
How to debug the Sandbox/Test environment in D365FO
Often developers come across some issue which requires debugging but debugging production database is no easy task as it requires a refresh of DB from production to sandbox environment from LCS, then requires export of DB from the sandbox via LCS and then the restoration of DB in the development environment which is a manual task and requires many commands and time overall. So how to debug the Sandbox/Test environment in D365FO
Above mentioned steps can be reduced to only one step i.e refresh of production DB to sandbox via LCS and later we can connect to sandbox environment directly from the development environment for debugging using below guide
Time required 20 minutes
Steps
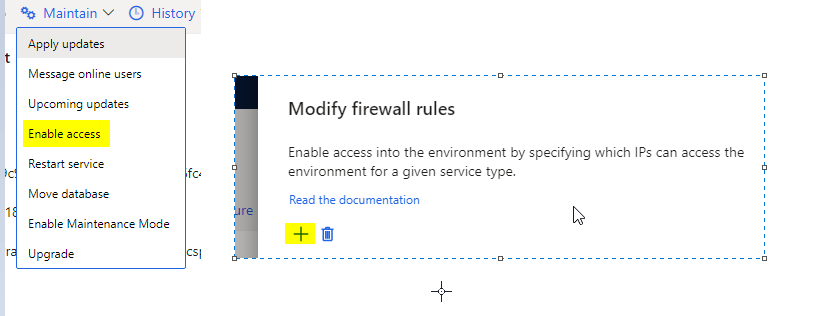
- Enable access for your IP address
Go to lcs ->sandbox environment page. To connect to test environment RDP, you need to create Whitelist rule for your IP address
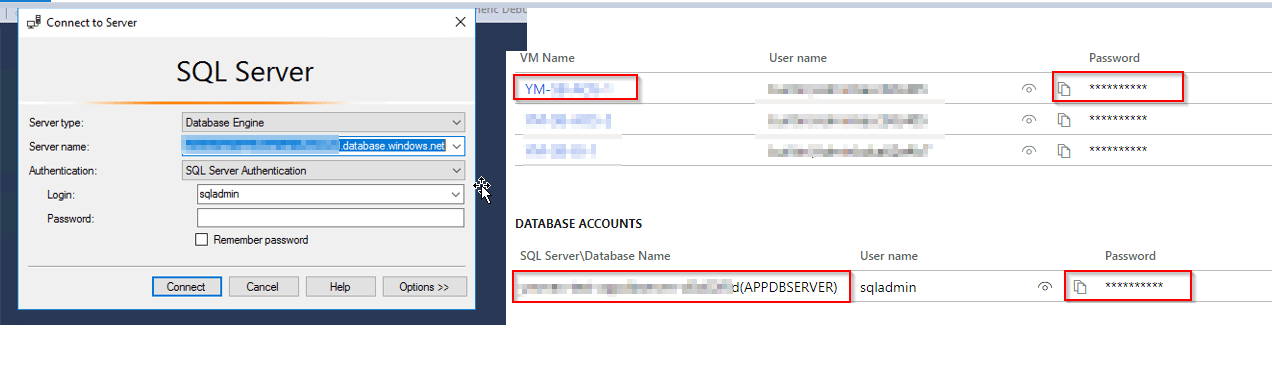
- Connect RDP and open SSMS
Connect to SQL server using Server name from LCS and add the prefix to SQL server name – servername.database.windows.net
- Create a new query to test DB
Below query will create a new user that will be used for debugging
CREATE USER devtempuser WITH PASSWORD = ‘pass@word1’
EXEC sp_addrolemember ‘db_owner’, ‘devtempuser’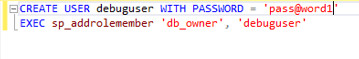
- Whitelist your IP address
Select new query against Master DB
exec sp_set_firewall_rule N’DEVNAME’, ‘IP’, ‘IP’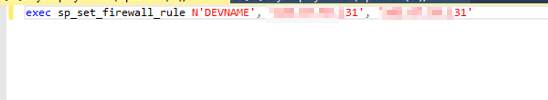
- Stop IIS, WWW service and Batch Service
Open IIS and stop the service. Open run and enter services.msc and stop WWW and Microsoft D365 batch service
- Edit Web config
Go to C:\AosService\webroot\web.config and save the original file somewhere else as backup. Modify 4 Keys as per the below screenshot.
You can either comment original configuration or delete it and add new configuration of the sandbox environment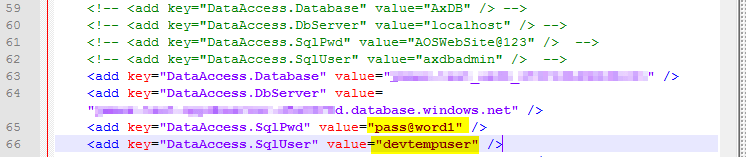
- Start IIS and WWW services
Start IIS and WWW service stopped in step 5. Don’t start batch service.
- Open the development environment AX URL
If you get 503 unavailable error, go to CMD(as admin) and type IISRESET
- Debug
Now sandbox environment is connected to your development environment. You can simply open Visual studio to add breakpoints to X++ object and attach w3wp.exe service to debug.
After following the above 9 easy to understand steps, you can now easily debug your sandbox environment. I hope this article helped you learn how to debug the Sandbox/Test environment in the D365fo development environment with minimal effort in D365 Fi- nance & operations AX. Don’t forget to share this article.
You may also want to see our article on How to remap workspace for Visual studio team services setup in D365 Finance & operations Development machine. You can find us on facebook.
 Facebook
 Linkedin
Comments: 6
You save my day
Thank you
You save my day. I love you my buoy.
Thank you so much Pawan sir
Thank you for such an informative article. Another way to do is to use JIT account as below https://docs.microsoft.com/en-us/dynamics365/fin-ops-core/dev-itpro/database/dbmovement-scenario-debugdiag
This process is no longer valid. You cannot RDP to a sandbox server anymore.
This is the new process (connect a developer tier1 VM to a sandbox database): https://learn.microsoft.com/en-us/dynamics365/fin-ops-core/dev-itpro/database/dbmovement-scenario-debugdiag